Tracking Multiple Events
Overview
This guide demonstrates how to track and analyze multiple performance events in your app using Marco. We'll extend the app startup example to track various events during the app's initialization and screen loading process.
Before you begin, make sure you've gone through the App Startup guide for basic setup and context.
Implementation Guide
1. Tracking App Launch Events
Let's add markers at key points during the app launch process to get a detailed breakdown of startup time.
App Launch Start (T1)
// MainApplication.kt
override fun onCreate() {
    // Track app launch start
    PerformanceTracker.track(
        "AppLaunchStart",
        System.currentTimeMillis(),
        null,
        true,
        applicationContext
    )
    super.onCreate()
    // ... rest of onCreate
}
Application OnCreate (T2)
// MainApplication.kt
override fun onCreate() {
    // ... previous code ...

    // Track application onCreate completion
    PerformanceTracker.track(
        "Application_onCreate",
        System.currentTimeMillis(),
        null,
        true,
        applicationContext
    )
}
Activity Creation (T3)
// MainActivity.kt
override fun onCreate(savedInstanceState: Bundle?) {
    super.onCreate(savedInstanceState)

    // Track activity creation
    PerformanceTracker.track(
        "ActivityCreated",
        System.currentTimeMillis(),
        null,
        true,
        applicationContext
    )
}
Make sure to set writeLogInFile: true for all track calls to persist the performance data.
2. Tracking Screen Events
Let's enhance our HomeScreen component to track various stages of screen loading:
import { PerformanceTracker } from '@d11/marco';
import { useState, useEffect } from 'react';
import { View, Text, ActivityIndicator, StyleSheet } from 'react-native';

// Configure Marco to persist performance data
PerformanceTracker.configure({
  persistToFile: true,
});

function HomeScreen(): React.JSX.Element {
  const [isLoading, setIsLoading] = useState(true);

  // Track screen mount (T4)
  useEffect(() => {
    PerformanceTracker.track('HomeScreen_Mounted', Date.now());
  }, []);

  // Simulate data loading
  useEffect(() => {
    setTimeout(() => {
      setIsLoading(false);
    }, 1000);
  }, []);

  if (isLoading) {
    // Track loading state (T5)
    return (
      <PerformanceTracker tagName="LoadingState">
        <View style={styles.container}>
          <ActivityIndicator size="large" color="#0000ff" />
        </View>
      </PerformanceTracker>
    );
  }

  // Track screen load completion
  return (
    <SafeAreaView style={styles.outerContainer}>
      <PerformanceTracker
        tagName="HomeScreen_Loaded"
        style={styles.outerContainer}
      >
        <View style={styles.container}>
          <Text testID="home_screen_text" style={styles.text}>
            Home Screen
          </Text>
        </View>
      </PerformanceTracker>
    </SafeAreaView>
  );
}

const styles = StyleSheet.create({
  container: {
    justifyContent: 'center',
    alignItems: 'center',
    backgroundColor: '#f0f0f0',
    borderWidth: 1,
    borderColor: 'black',
    borderRadius: 10,
    padding: 10,
  },
  text: {
    fontSize: 24,
    fontWeight: 'bold',
  },
  outerContainer: {
    flex: 1,
    justifyContent: 'center',
    alignItems: 'center',
  },
});
3. Running Performance Tests
Use an instrumentation tool like Maestro to run automated tests and collect performance data.
4. Configuration
Create a marco.config.js file in your project root:
// marco.config.js
module.exports = {
  android: {
    packageName: 'com.example.app',
    outputPath: './marco-reports/android',
    dataDir: [
      {
        path: './marco-reports/android/log.json',
        reportName: 'AndroidReport1',
      },
    ],
    port: '8080',
  },
  ios: {
    packageName: 'com.example.app',
    outputPath: './marco-reports/ios',
    dataDir: [
      {
        path: './marco-reports/ios/log.json',
        reportName: 'iosReport1',
      },
    ],
    port: '8080',
  },
};
5. Generating Performance Reports
Run the following command to collect performance data:
yarn marco generate --platform android
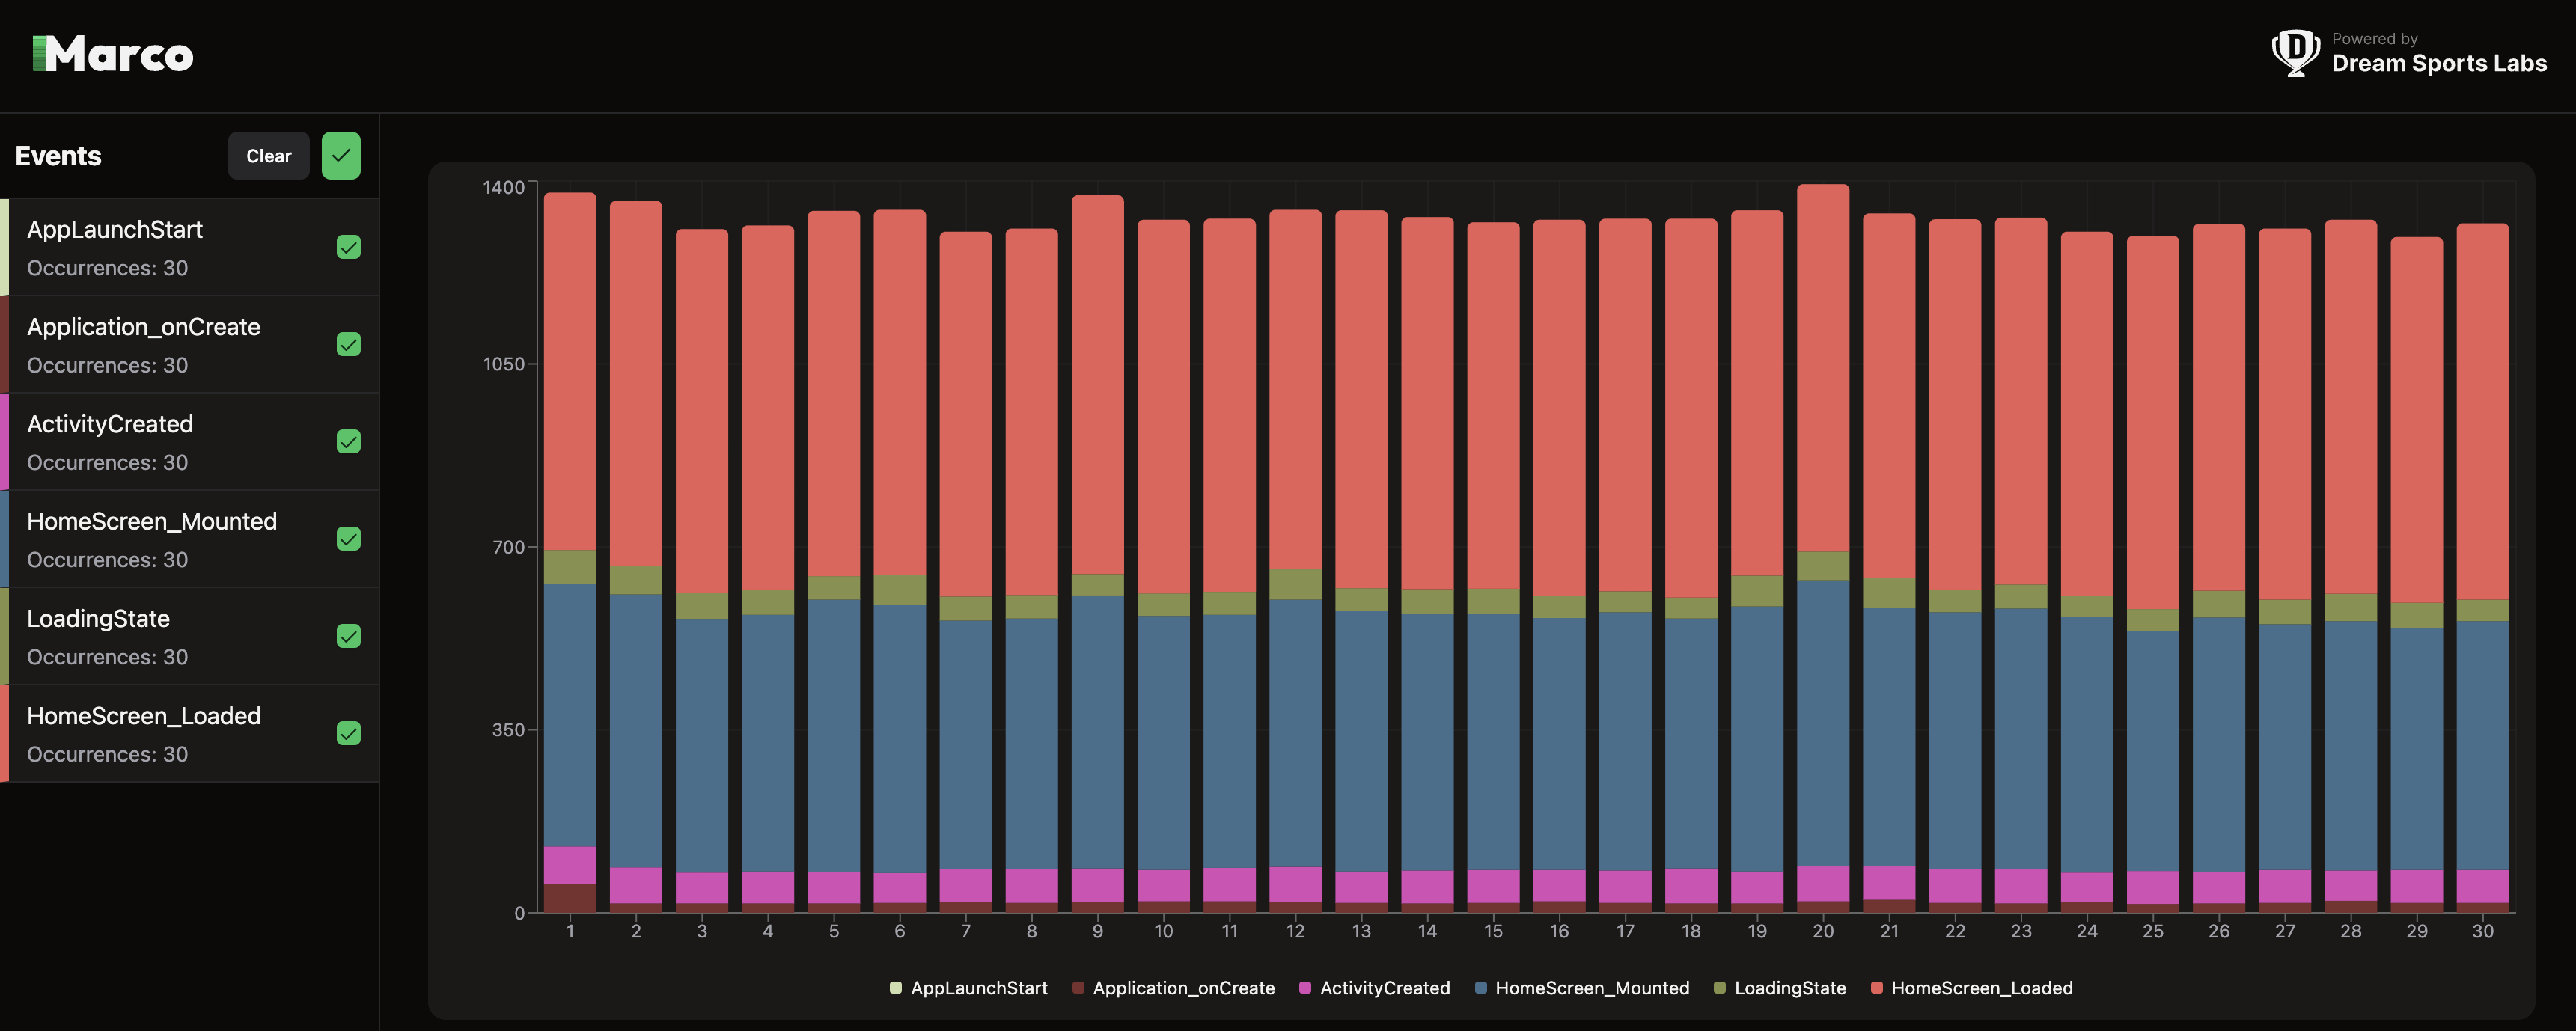
6. Visualizing Performance Data
To view your performance data in an interactive dashboard:
yarn marco visualize --platform android
The dashboard will be available at http://localhost:8080 and provides:
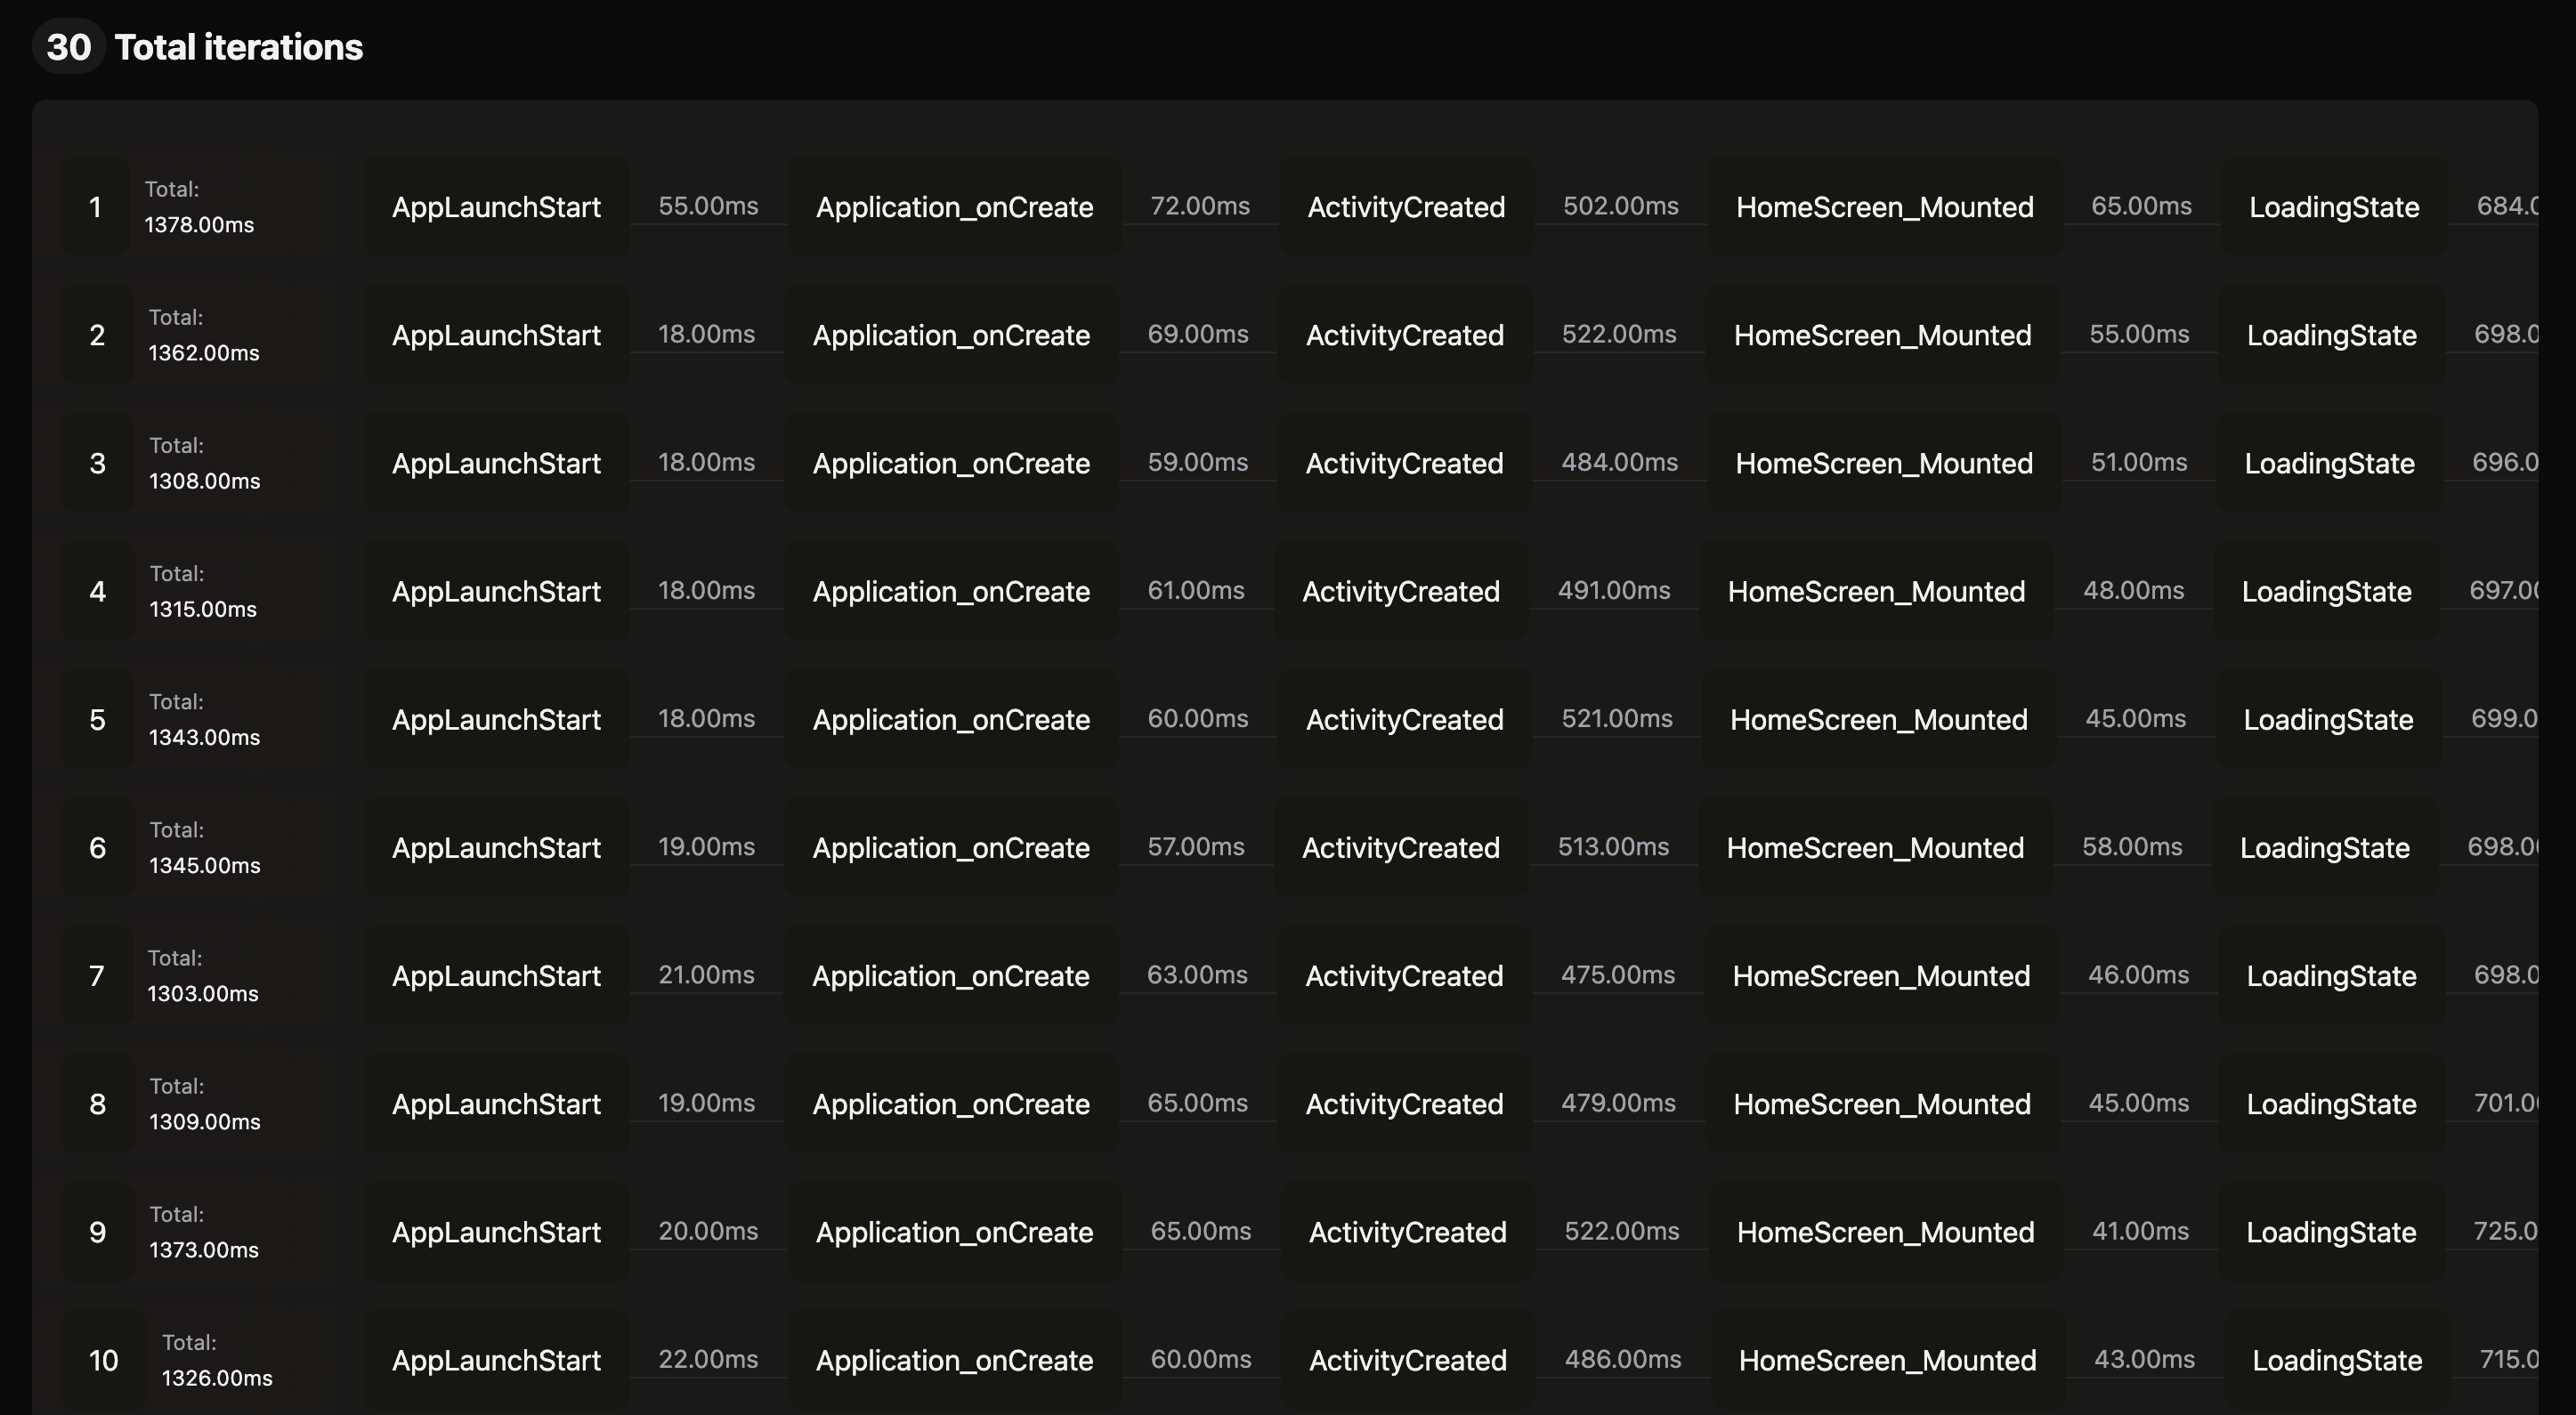
- Timeline view of all tracked events
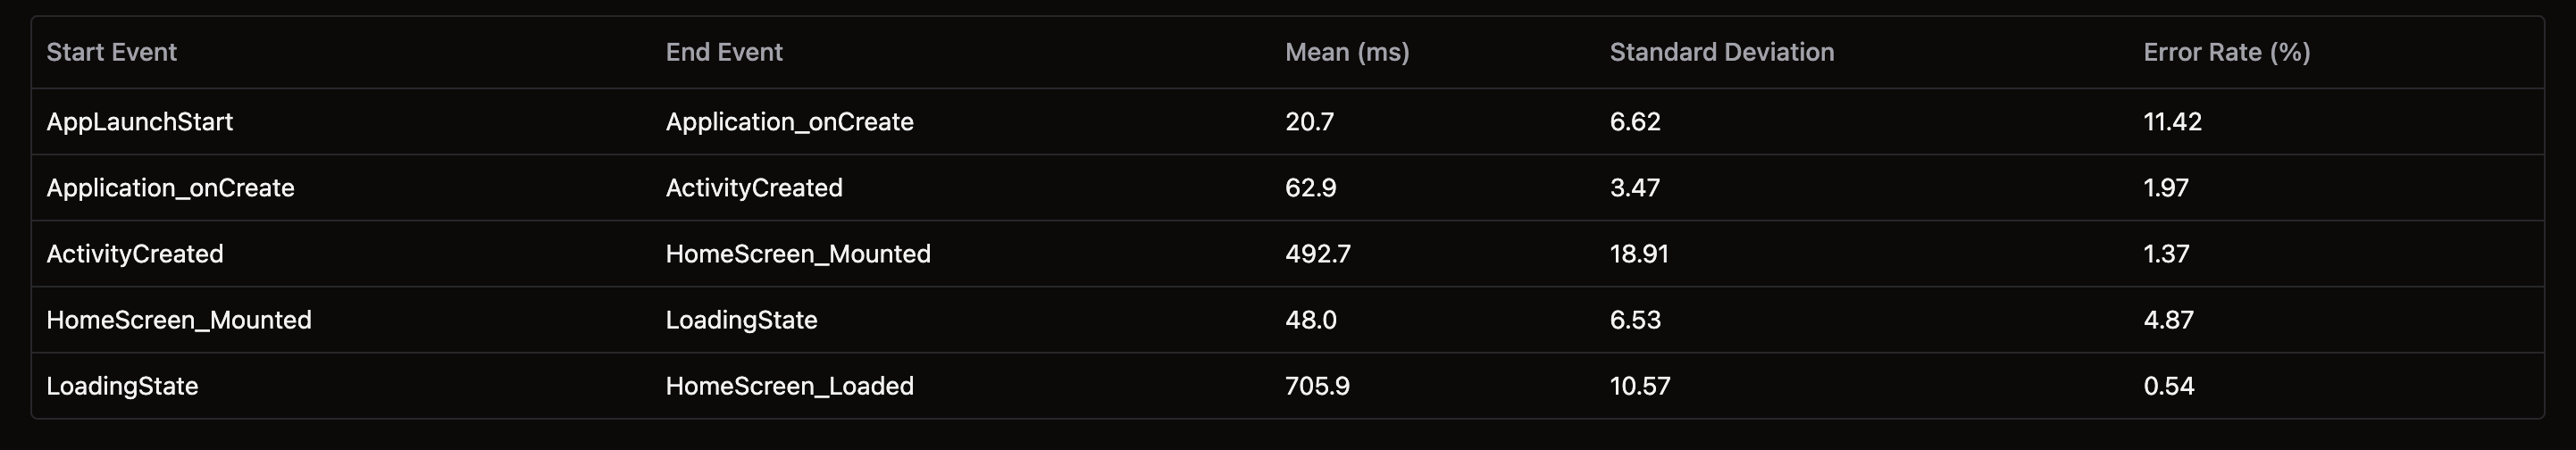
- Performance metrics visualization
- Comparison across multiple test runs
- Detailed analysis of time between events
Next Steps
- Learn about App Startup Performance
- Explore Screen Load Time Tracking
- Check out the API Reference for more features