Visualization
This command is needed when we want to use CLI to visualize performance reports for Android or iOS applications, or to override the values in the config file.
yarn marco visualize --helpUsage: marco visualize [options]
Serve the performance report dashboard
Options: -p, --port <port> Specify the port (default: "8080") -d, --dataDir <dataDir> Specify the data directory path and custom report name --platform <platform> Specify platform: android or ios -h, --help display help for commandOptions
--platform <platform>: Specify platform: android or ios. If want to read values from the config file, specify the platform.-p, --port <port>: Specify the port for the dashboard (default: 8080).-d, --dataDir <dataDir>: ‘Specify the directory containing the performance reports as “path:custom_report_name” (e.g., “report/log.json:My Report”) — wrap in quotes if the name contains spaces’
Example:
yarn marco visualize --platform android --port 3000With data source path:
This is useful when we want to visualize the data from a different directory.
yarn marco visualize --dataDir "./path/to/log.json:custom_report_name"Marco Dashboard
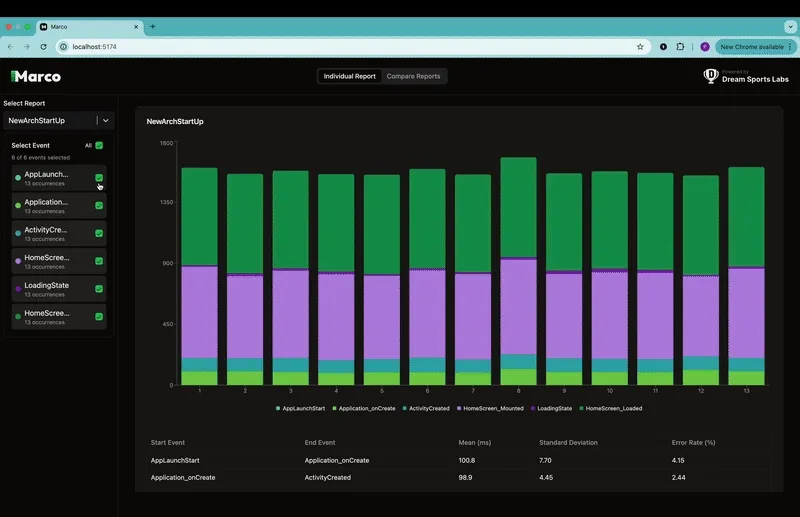
Features of the Visualization Dashboard:
- In Side bar, we can see all the markers with there occurrence.
- Iteration wise data is shown in bar chart.
- Raw data are processed and shown in timeline for better understanding.
- Also have access to other metrics like mean, standard deviation, error rate to predict the correctness of the data.
- We can play around with multiple events to see how they perform together.